AI TOOL / #04119
Querri
An AI-powered data platform enables non-technical users to easily clean, analyze, and visualize data.
Introduction
AI-powered data platform for non-tech users to easily clean, analyze, and visualize data.
What is Querri?
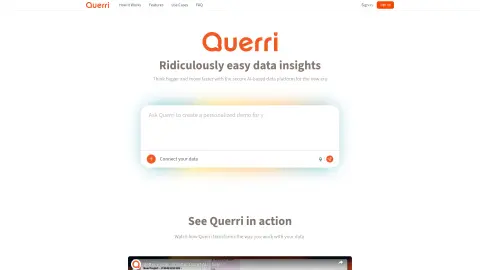
Querri is an AI-driven intelligent data platform designed specifically for non-technical users. It enables users to clean data in simple English, create charts and visuals, and perform complex analyses. Querri makes data insights incredibly easy to obtain, providing immediate answers, automatic reports, and powerful analytical tools – all without the need for sophisticated data stacks or coding knowledge. It is an integrated, versatile data platform that incorporates responsible AI technologies and security measures, offering a comprehensive set of data solutions.
How to use Querri?
Connect your data to Querri and then pose questions in natural language. Querri will automatically clean, transform, and analyze the data, providing visual answers in the form of charts and tables. You can also automate any analysis process to create dashboards that help you track trends and gain repeatable insights over time.
The core functions of Querri
AI-driven data analysis
Natural Language Query
Automated data cleaning and conversion
Real-time visualization and reporting
Automated dashboard
Natural Language Query
Automated data cleaning and conversion
Real-time visualization and reporting
Automated dashboard
Related
aiflowchart
Tools based on artificial intelligence can generate flowcharts, graphs, and charts from various sources.
Flowsage Extension – Turn ideas into shareable flowcharts
An AI-powered Chrome extension that converts text into flowcharts in real time, facilitating collaborative work.
Unifyr.ai
Unifyr is a data aggregation platform designed for commercial tracking and automated reporting.
Text Assistant
A Chrome extension that utilizes the OpenAI API for writing, proofreading, and analyzing text.
AskEdith Free Tier
AI-powered analysis tools enable quick retrieval of data insights through natural language queries.
Graphy for Data Storytelling
Graphy enables the creation of simple, fast, and visually appealing charts, thus simplifying the process of presenting data.